Exit Strategy Decision Tool
One set of deal numbers, five exits side by side, best return and biggest profit flagged
An Excel comparison tool for investors. Enter one property's ARV, price, repairs, rent, and financing once and see cash required, profit, ROI, and timeline for Wholesale, Flip, BRRRR, Hold, and Seller Finance, best rows highlighted.
Most investors decide the exit before they run the numbers. A wholesaler assigns a deal that would have cleared six figures as a flip. A flipper sells a house that would have refinanced to zero cash left in and paid rent for a decade. The strategy was chosen by habit, and the spreadsheet, if there was one, only ever modeled that strategy.
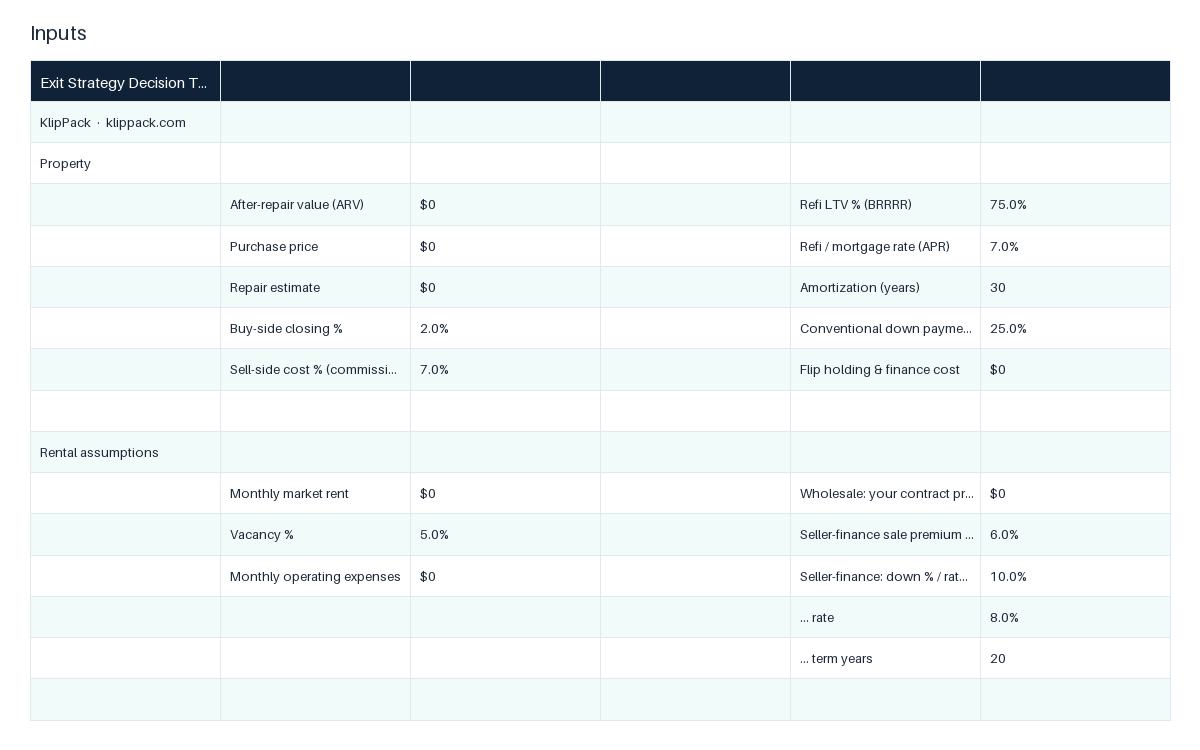
This workbook runs all five at once from a single input sheet. On the Inputs tab you enter the property numbers one time: after-repair value, purchase price, repair estimate, buy-side closing percent, sell-side cost percent, market rent, vacancy, monthly operating expenses, plus the financing assumptions for each exit (refinance LTV and rate for BRRRR, conventional down payment for a hold, flip holding and finance cost, your wholesale contract price, and the seller-finance premium, down payment, rate, and term). The Comparison tab returns a five-row table with cash required, profit, ROI on cash, and a realistic timeline for each strategy. Wholesale profit follows the 70 percent rule (ARV times 70 percent minus repairs minus your contract price). BRRRR and Buy and Hold profit are equity captured plus year-one cash flow after a PMT-based mortgage payment. Seller finance profit is the down payment plus the full note payments minus your all-in cost. A BEST ROI flag marks the highest return on cash, a bottom row names the highest total profit, and two conditional-formatting rules shade the best-ROI row green and the highest-profit row amber so the gap between the two is visible at a glance. The Decision Guide tab is a plain-language page on how to read the table honestly: why wholesale ROI looks absurd, when each exit tends to win, the Dodd-Frank note for owner-occupant seller financing, and three sanity checks before you commit. 22 formulas, no macros.
You come away knowing which exit the deal itself favors and how far apart the alternatives are, which is usually the real decision. To start, fill the yellow cells on Inputs with your ARV, price, and repairs, add rent and expenses if you might hold, set your contract price if you might assign, then read the Comparison tab and the Decision Guide. Re-run it with the ARV cut by ten percent before you write the offer.
Who it's for
For active investors and wholesalers who find deals first and want the numbers to choose the exit, and for anyone presenting options to a money partner. Not a replacement for the deep single-strategy models: once you pick the exit, run it in the Fix and Flip Profit Calculator, the BRRRR Strategy Analyzer, or the Rental Property Cash Flow Calculator. Not for land deals; use the Vacant Land Investment Analyzer's exit planner instead.
Use it when
- You have a house under contract at a good price and are unsure whether to assign it or flip it
- A partner says BRRRR and you suspect a plain hold cash-flows better on this one
- A seller will carry paper and you want to see what selling on terms earns versus a cash sale
- You are presenting a deal to a JV investor and need all the options on one page
- You want to stress-test an exit by cutting the ARV ten percent and seeing which strategies survive
What you download
Every file in the XLSX download.
Inside the files
- Inputs sheet: one set of property, rental, and financing numbers
- Comparison sheet: Wholesale, Flip, BRRRR, Hold, Seller Finance
- Cash required, profit, ROI on cash, and timeline for each exit
- BEST ROI flag and highest-profit row, shaded green and amber
- Decision Guide sheet: when each exit wins, plus three sanity checks
What changes once you use it
- 1Let the deal pick the exit instead of defaulting to the one you always use
- 2See cash required next to profit so a huge ROI on tiny cash is not mistaken for a big win
- 3Spot when the best-ROI exit and the biggest-profit exit disagree
- 4Show partners five modeled options on one page
- 5Change one input and all five strategies update
Common questions
What software do I need?
Microsoft Excel or Google Sheets. Standard .xlsx with PMT, INDEX, and MATCH formulas and two conditional-formatting rules; no macros.
How is each strategy's profit calculated?
Wholesale: ARV times 70 percent minus repairs minus your contract price. Fix and Flip: ARV less selling costs, minus purchase, repairs, closing, and holding cost. BRRRR and Buy and Hold: equity captured at the after-repair value plus year-one cash flow after the new loan payment. Seller Finance: down payment plus total note payments over the term minus your all-in cost. The Comparison sheet states these in its footnotes.
Why does wholesale show such a high ROI?
Because cash required is tiny and the timeline is weeks. The Decision Guide explains the time-horizon trap and tells you to compare profit per dollar per year, not raw ROI. That is why the tool also names the highest total profit separately.
Can I use this to pitch a deal to partners or JV investors?
Yes. The Comparison sheet is one table with cash required, profit, ROI, and timeline for all five exits, which is the slide most partners want to see. Pair it with the deal-specific calculator for the exit you choose.
Why not a free template or ChatGPT?
Free calculators model one strategy at a time with separate inputs, so comparing exits means re-typing the deal five times and trusting that the assumptions match. A chat answer cannot keep the five models consistent when you change the ARV. This file shares one input set across all five, uses real mortgage math for the hold and refinance scenarios, and highlights the disagreement between best ROI and biggest profit, which is the insight generic tools miss.
💰 Fund: Line up cash buyers and private money
Got this handled? Here's what comes next in the deal.
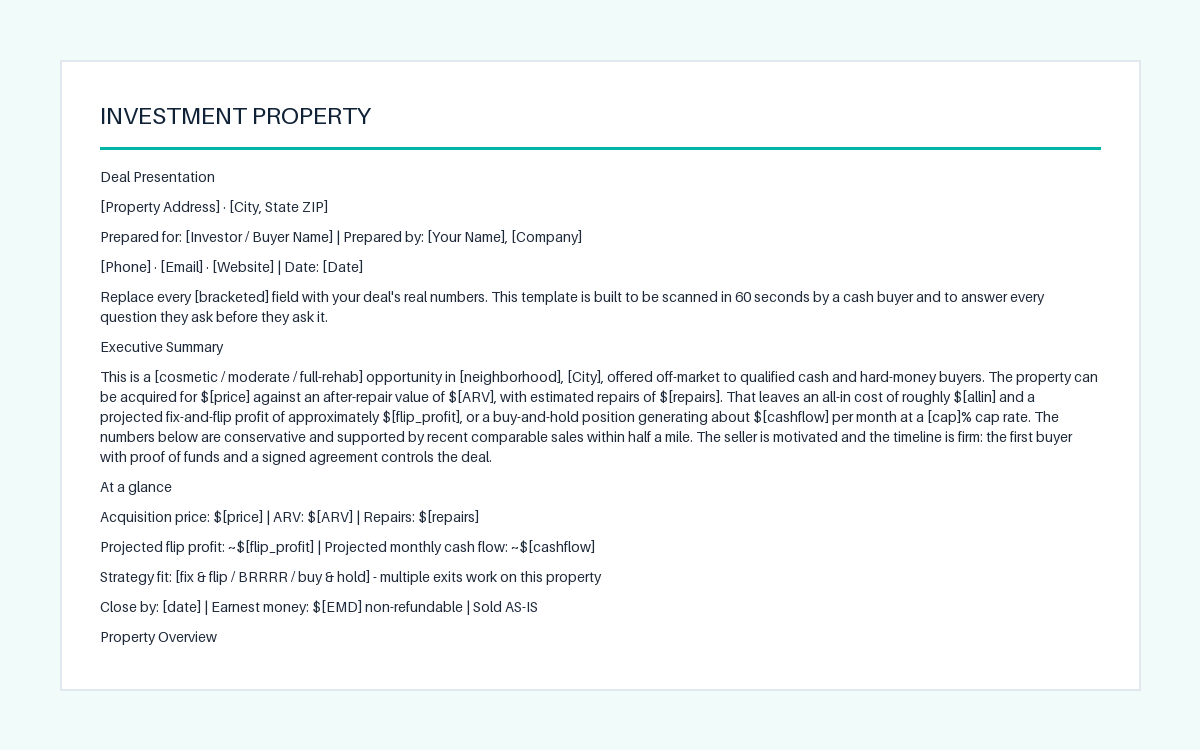
Cash Buyer Deal Presentation Template
Turn a deal into a one-read packet cash buyers can say yes to
- ✓Cover page with property, buyer, and your contact fields
- ✓At-a-glance block: price, ARV, repairs, flip profit, cash flow
- ✓Fix & Flip and Rental analyses laid out side by side
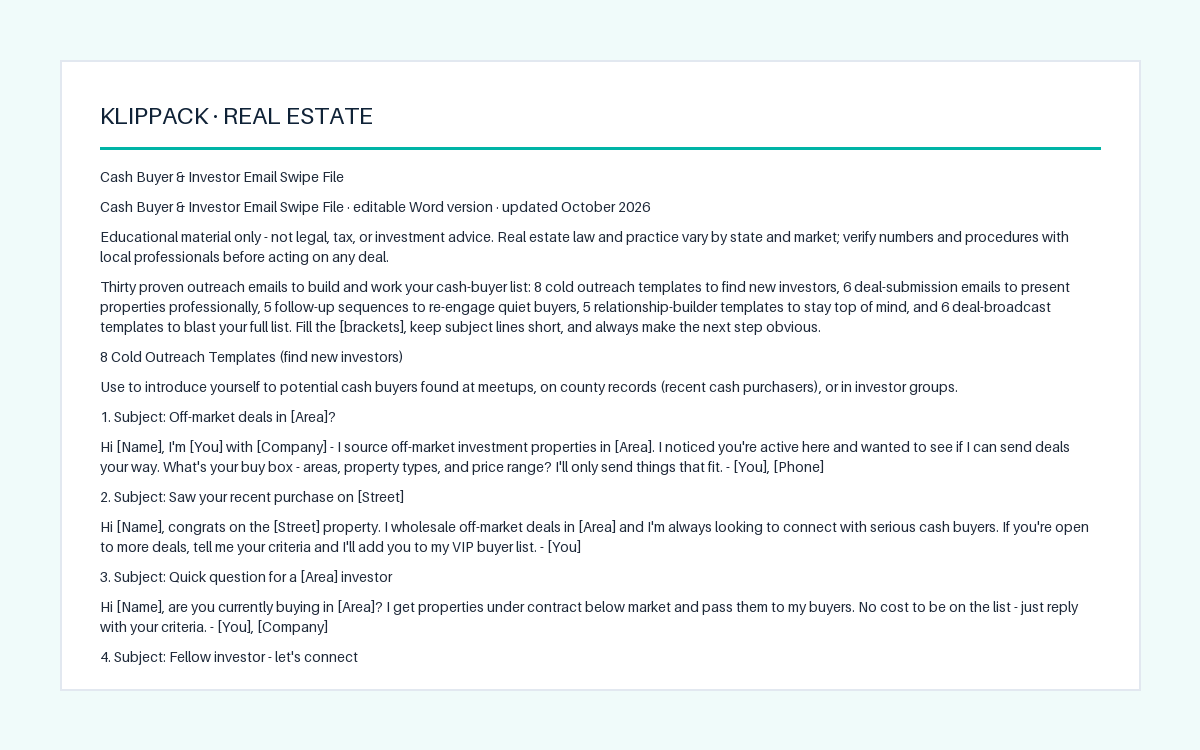
Cash Buyer & Investor Email Swipe File
30 fill-in-the-brackets emails to build and work a cash buyer list
- ✓8 Cold Outreach emails to introduce yourself to new investors
- ✓6 Deal Submission emails: flip, rental, pocket deal, price drop
- ✓5 Follow-Up emails to re-engage quiet buyers, ending in a last call
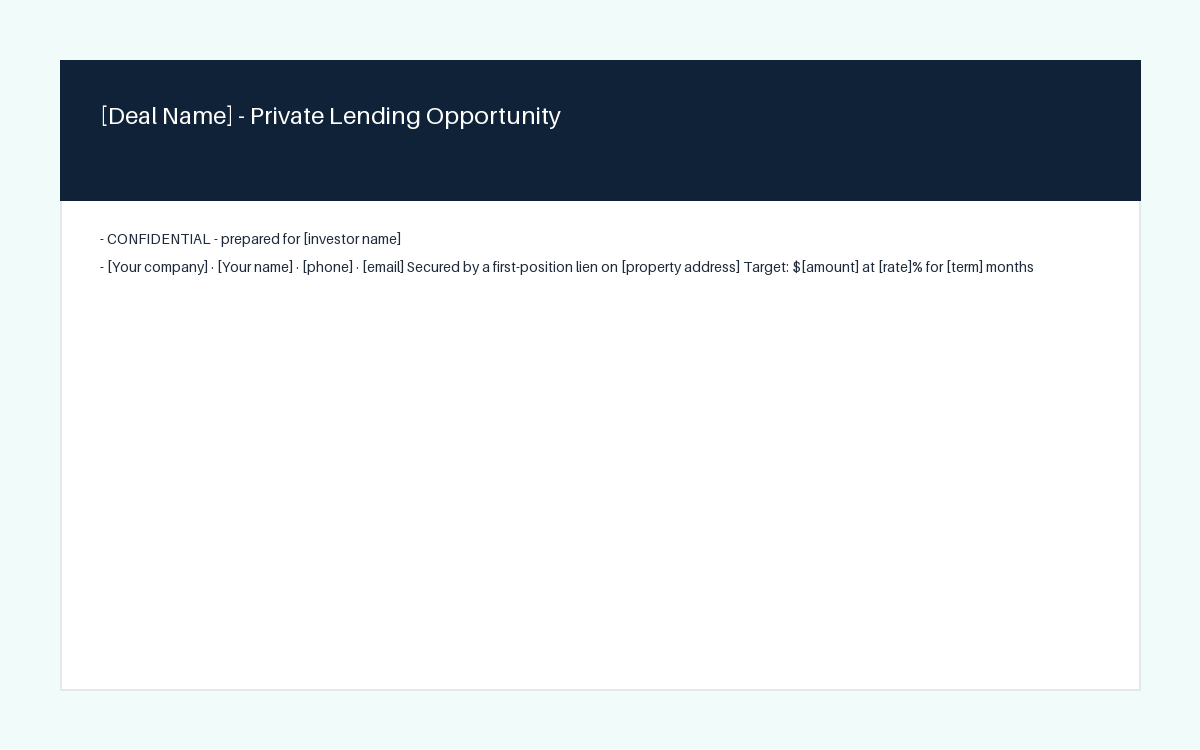
Private Money Pitch Deck Template
A 12-slide lender pitch with the security and downside slides investors ask for
- ✓Confidential cover: target amount, rate, term, and secured property
- ✓Opportunity, Track Record, and Team slides with bracketed proof points
- ✓Deal and Numbers slides: all-in cost, ARV, loan-to-ARV, worst case