Rental Property Cash Flow Calculator
Monthly cash flow, cap rate, and 5-year equity before you write the offer
A 3-sheet Excel calculator for buy-and-hold rentals: mortgage payment, 12 itemized expenses, cash flow, cap rate, cash-on-cash, a 5-year equity projection, and a side-by-side comparison of three properties.
A rental looks good on the listing and bad on the first of the month. Gross rent minus mortgage is not cash flow; vacancy, CapEx reserves, turnover, management, and a dozen smaller line items are what separate a property that pays you from one you pay for. New landlords learn this after closing. The calculator exists so you learn it before.
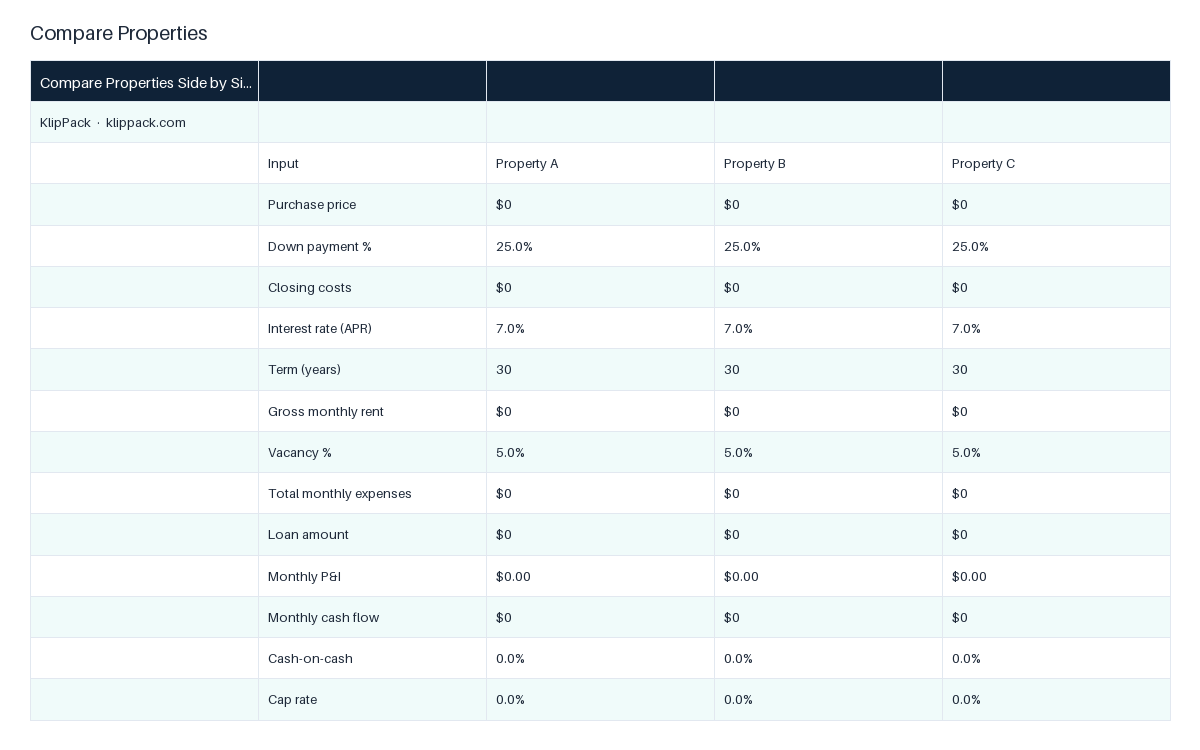
The Rental Property Cash Flow Calculator is a 3-sheet Excel workbook with 46 formulas. The Cash Flow sheet takes purchase price, down payment, closing costs, rate, and term and returns loan amount and monthly principal and interest. Income has rows for gross rent, other income (parking, laundry, storage), and a vacancy percentage. Expenses are itemized across 12 categories: property taxes, insurance, HOA, management, repairs and maintenance, CapEx reserve, owner-paid utilities, lawn and snow and pest, bookkeeping, leasing and turnover reserve, legal and professional, and other. Returns compute monthly and annual cash flow, annual NOI, cap rate, and cash-on-cash on your actual cash invested (down payment plus closing costs). The 5-Year Equity sheet applies an appreciation rate, amortizes the loan balance year by year, and shows equity, cumulative cash flow, and total 5-year equity gain. The Compare Properties sheet lines up three candidates with their own price, financing, rent, vacancy, and expenses and returns cash flow, cash-on-cash, and cap rate for each.
You end up with one number a lender, a partner, or your own gut can argue with: what this property puts in your pocket each month after everything. First 15 minutes: enter the purchase and loan terms, type the rent and your best estimate for each of the 12 expenses, read the Returns block, then copy the inputs into Compare Properties next to the other two houses on your list. Works in Microsoft Excel and Google Sheets.
Who it's for
For buy-and-hold investors, house hackers, and first-time landlords underwriting a long-term rental with conventional financing. Not for short-term rentals, which need nightly-rate and occupancy modeling in the Short-Term Rental Income Analyzer, and not for a BRRRR where the refinance is the point.
Use it when
- You found a duplex on the MLS and want to know tonight whether it cash flows at asking price
- Your lender asks for your numbers and you want a clean sheet with NOI, cap rate, and cash-on-cash
- You are choosing between three houses and want them ranked on the same assumptions
- A partner asks what the property is worth to you in five years, not just this year
- You are deciding how much to put down and want to see cash flow and cash-on-cash move together
What you download
Every file in the XLSX download.
Inside the files
- Cash Flow sheet: purchase, financing, monthly P&I from rate and term
- 12 itemized monthly expense categories, including CapEx and turnover
- Vacancy rate and other-income rows feed effective income
- Returns: monthly and annual cash flow, NOI, cap rate, cash-on-cash
- 5-Year Equity: appreciation, loan paydown, equity, cumulative cash
- Compare Properties: three candidates side by side on one sheet
What changes once you use it
- 1See true monthly cash flow after all 12 expense lines, not rent minus mortgage
- 2Cap rate and cash-on-cash computed on the money you actually put in
- 3Five-year equity view shows paydown plus appreciation, not just year one
- 4Rank three properties on the same assumptions before you tour them
- 5Every formula visible and editable, so you can defend the numbers to a lender
Common questions
What software do I need?
Microsoft Excel or Google Sheets. Standard .xlsx, no macros; also opens in LibreOffice and Numbers.
Does it work for multi-family?
Yes for 2 to 4 units. Enter total rent across units in the gross rent row and your combined expenses in the 12 categories. There is no per-unit breakdown sheet; for a unit-by-unit rent roll you would add rows yourself.
Does it include vacancy and reserves?
Yes. A vacancy percentage cell reduces effective income, and the expense list has dedicated rows for CapEx reserve and leasing and turnover reserve so those costs are in the monthly number instead of surprising you later.
Why not a free template or ChatGPT?
Most free rental calculators give you one sheet and three or four expense lines, so they overstate cash flow. This one itemizes 12 categories, amortizes the loan for a real 5-year equity figure, and compares three properties on identical assumptions. The formulas are all on the sheet; nothing is hidden.
What if I am doing a BRRRR or a flip instead?
Use the BRRRR Strategy Analyzer for a buy-rehab-refinance deal or the Fix & Flip Profit Calculator for a resale. This calculator is for a conventional buy-and-hold.
💰 Fund: Line up cash buyers and private money
Got this handled? Here's what comes next in the deal.
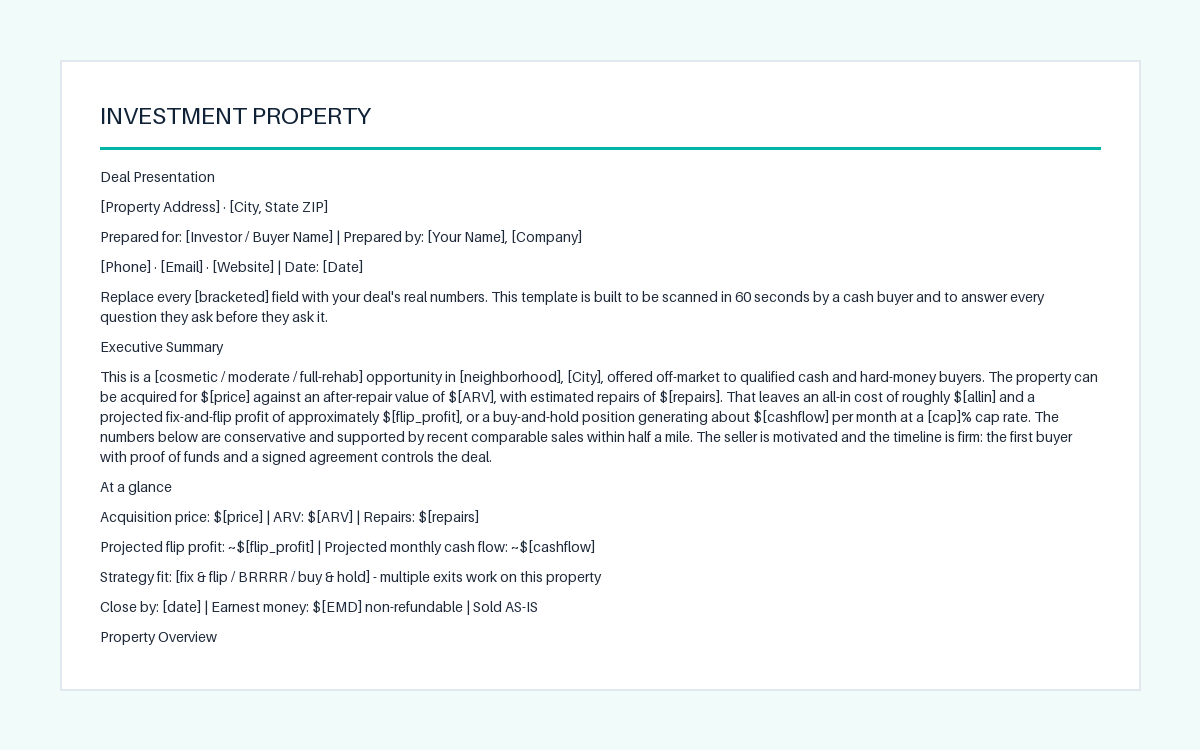
Cash Buyer Deal Presentation Template
Turn a deal into a one-read packet cash buyers can say yes to
- ✓Cover page with property, buyer, and your contact fields
- ✓At-a-glance block: price, ARV, repairs, flip profit, cash flow
- ✓Fix & Flip and Rental analyses laid out side by side
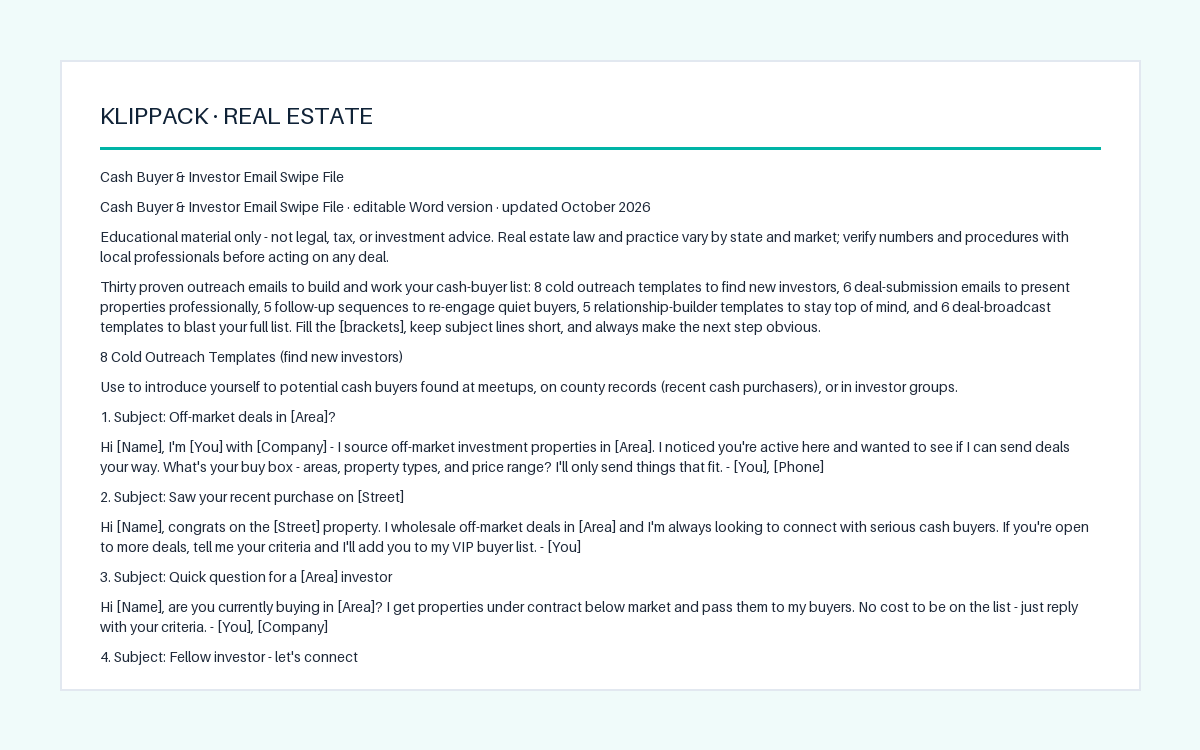
Cash Buyer & Investor Email Swipe File
30 fill-in-the-brackets emails to build and work a cash buyer list
- ✓8 Cold Outreach emails to introduce yourself to new investors
- ✓6 Deal Submission emails: flip, rental, pocket deal, price drop
- ✓5 Follow-Up emails to re-engage quiet buyers, ending in a last call
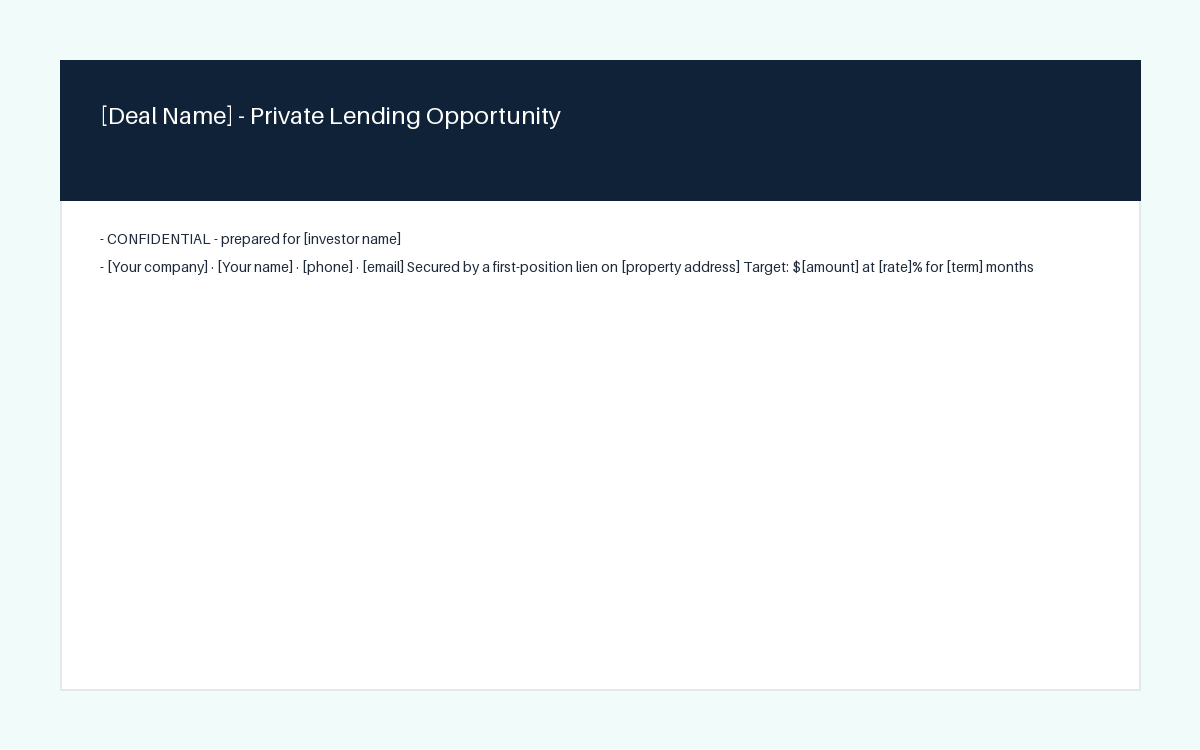
Private Money Pitch Deck Template
A 12-slide lender pitch with the security and downside slides investors ask for
- ✓Confidential cover: target amount, rate, term, and secured property
- ✓Opportunity, Track Record, and Team slides with bracketed proof points
- ✓Deal and Numbers slides: all-in cost, ARV, loan-to-ARV, worst case