Short-Term Rental Income Analyzer
Month-by-month Airbnb and VRBO underwriting with the long-term rental comparison built in
An Excel short-term rental analyzer. Enter ADR and occupancy for all 12 months plus expenses and financing to get revenue, NOI, cap rate, cash flow, and cash-on-cash, then compare the same property as a long-term rental.
Airbnb and VRBO revenue estimates assume every month looks like peak season. Real vacation markets do not. A beach house that clears $9,000 in July may book six nights in February, and a single annual occupancy number hides that swing. Buyers who underwrite on a platform estimate find out the truth after closing, when the winter mortgage payments arrive without the bookings.
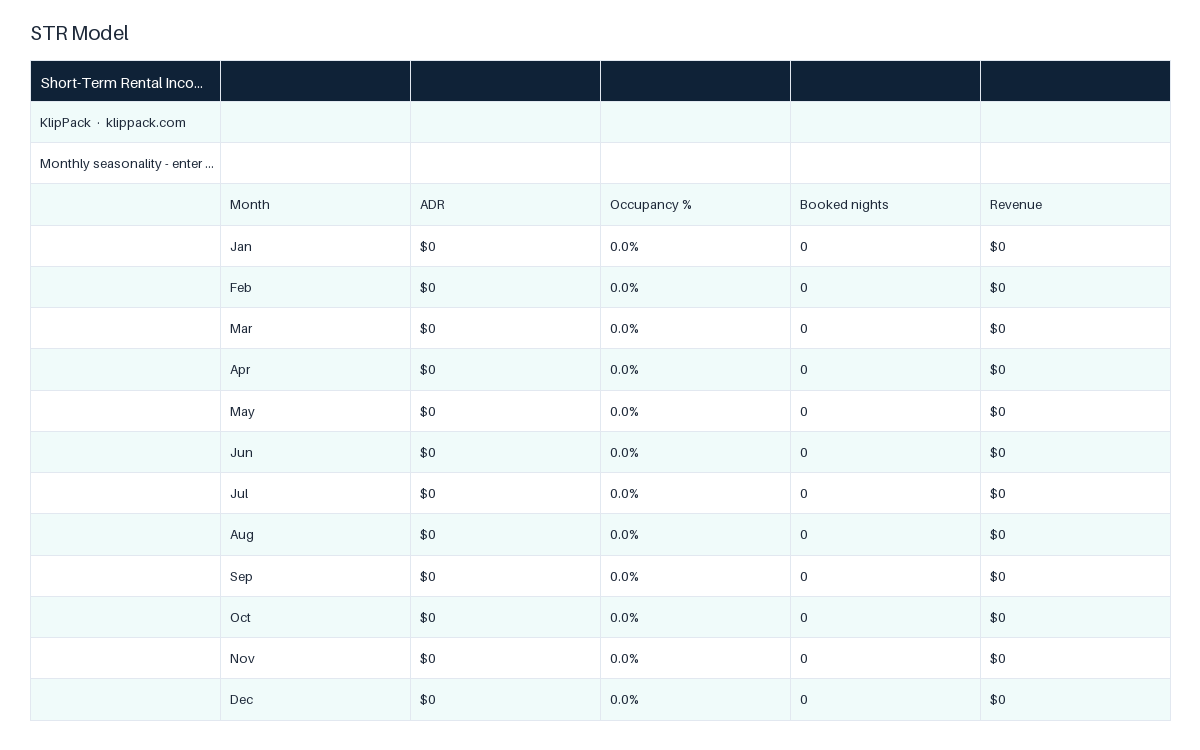
This workbook makes you enter the year the way it actually happens. The STR Model sheet has a 12-row seasonality table: type an average daily rate and an occupancy percentage for each month and it computes booked nights using each month's real day count (February is 28, not 30) and the monthly revenue. Below that, an operating-expense block prices platform fees as a percentage of revenue, derives turnovers per year from your average stay length and charges cleaning per turnover, and itemizes supplies, utilities, STR insurance, property taxes, management percentage, and an HOA, permit, and software line. A purchase and financing block takes price, closing costs, furnishing budget, down payment, APR, and term, and uses a PMT formula for the monthly payment. The Returns block gives NOI, cap rate, annual cash flow after debt service, and cash-on-cash return. The second sheet, STR vs LTR, pulls the STR results across and lines them up against a long-term rental scenario (market rent, vacancy, operating expenses, management) using the same purchase and financing, so the difference you see is purely operating strategy. 63 formulas across the two sheets, no macros.
You leave with a monthly revenue picture you can defend and a side-by-side answer to the question every STR buyer should ask first: does this property beat simply renting it long-term? To get started, fill the 12 ADR and occupancy cells from your market research (AirDNA, comparable listings, or your own bookings), enter the expense and financing inputs in the blue cells, then read the Returns block and flip to the STR vs LTR tab. Set occupancy to zero for any month you plan to block off for personal use.
Who it's for
For investors evaluating a specific Airbnb, VRBO, or mid-term furnished rental purchase who have market ADR and occupancy data to plug in. Not for operators who already own and want to manage bookings, pricing, or cleaners; this is an underwriting tool, not a management system. If you are comparing a conventional buy-and-hold instead, start with the Rental Property Cash Flow Calculator.
Use it when
- You found a lake house listing and need to know if the off-season kills the deal
- A seller's agent quotes 'gross $60k on Airbnb' and you want to stress-test it month by month
- You own a long-term rental and are deciding whether converting to STR is worth the furnishing cost
- You are comparing two STR markets with different seasonality curves on the same budget
- A lender or partner wants to see NOI and cash-on-cash, not a platform screenshot
What you download
Every file in the XLSX download.
Inside the files
- 12-month seasonality table: ADR and occupancy per month, real days
- Platform fee, cleaning per turnover, management, insurance, tax, HOA
- Turnovers per year derived from average stay length
- Purchase and financing block with PMT-based monthly payment
- Returns: NOI, cap rate, annual cash flow, cash-on-cash
- STR vs LTR sheet: the same property under both strategies
What changes once you use it
- 1Underwrite on a real monthly calendar instead of a platform's annual estimate
- 2See the winter months before you buy, not after
- 3Price cleaning and platform fees the way they actually hit your statement
- 4Answer whether the property beats a long-term lease in one view
- 5Change any assumption and every return metric updates instantly
Common questions
What software do I need?
Microsoft Excel or Google Sheets. The file is a standard .xlsx with ordinary formulas and no macros, so it opens in Numbers and LibreOffice as well.
Does it handle seasonality and dynamic pricing?
Yes. Every month has its own ADR and occupancy input, so you can model a $450 July and a $140 February in the same year. Booked nights use each month's real number of days.
Who pays the cleaning fee in the model?
Either way works. If guests pay cleaning, leave the cleaning cost per turnover at zero and keep cleaning revenue out of your ADR. If you absorb it, enter your cost per turnover and the sheet multiplies by turnovers per year.
Why not a free template or ChatGPT?
Free STR calculators almost always take one occupancy number for the whole year, and a chat answer cannot recalculate when you change an input. This file forces a 12-month view, ties cleaning to turnovers and platform fees to revenue, uses a proper PMT mortgage calculation, and compares against a long-term rental on identical financing. It is the structure, not the arithmetic, that you are buying.
Does it include a long-term rental comparison?
Yes. The STR vs LTR sheet takes market rent, vacancy, expenses, and management for a conventional lease and shows gross income, operating expenses, NOI, debt service, cash flow, and cash-on-cash next to the STR numbers, with the STR advantage computed for each line.
💰 Fund: Line up cash buyers and private money
Got this handled? Here's what comes next in the deal.
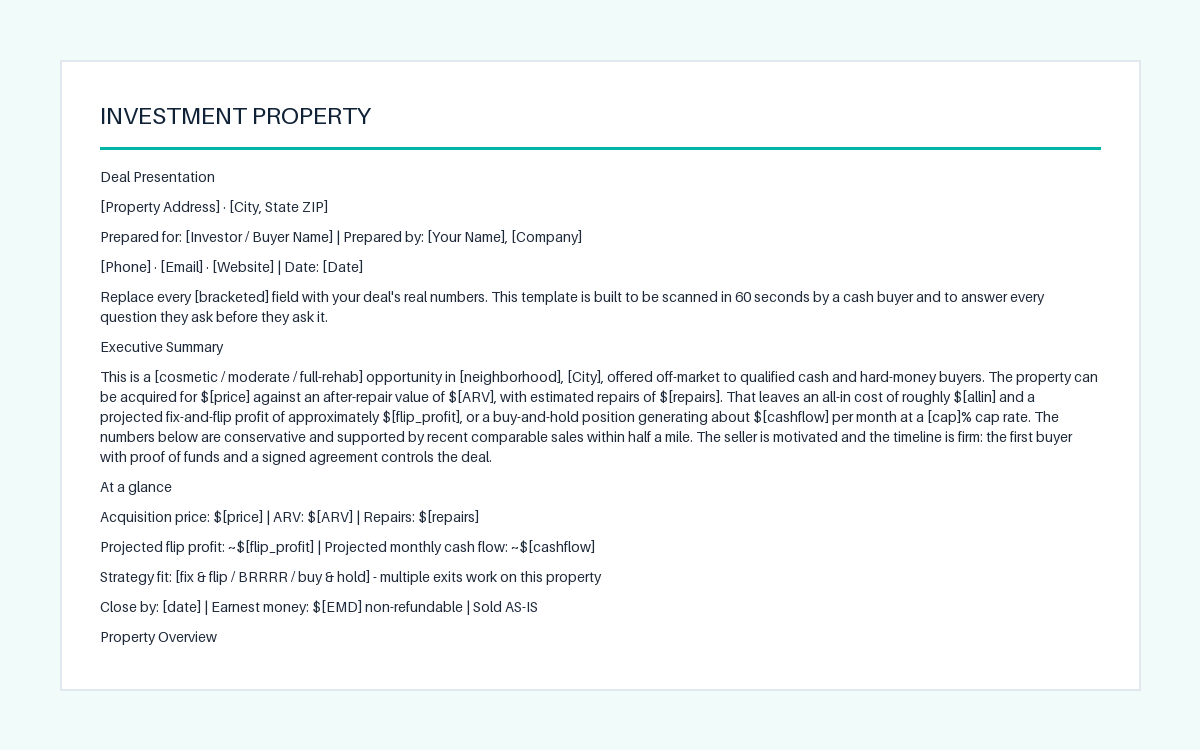
Cash Buyer Deal Presentation Template
Turn a deal into a one-read packet cash buyers can say yes to
- ✓Cover page with property, buyer, and your contact fields
- ✓At-a-glance block: price, ARV, repairs, flip profit, cash flow
- ✓Fix & Flip and Rental analyses laid out side by side
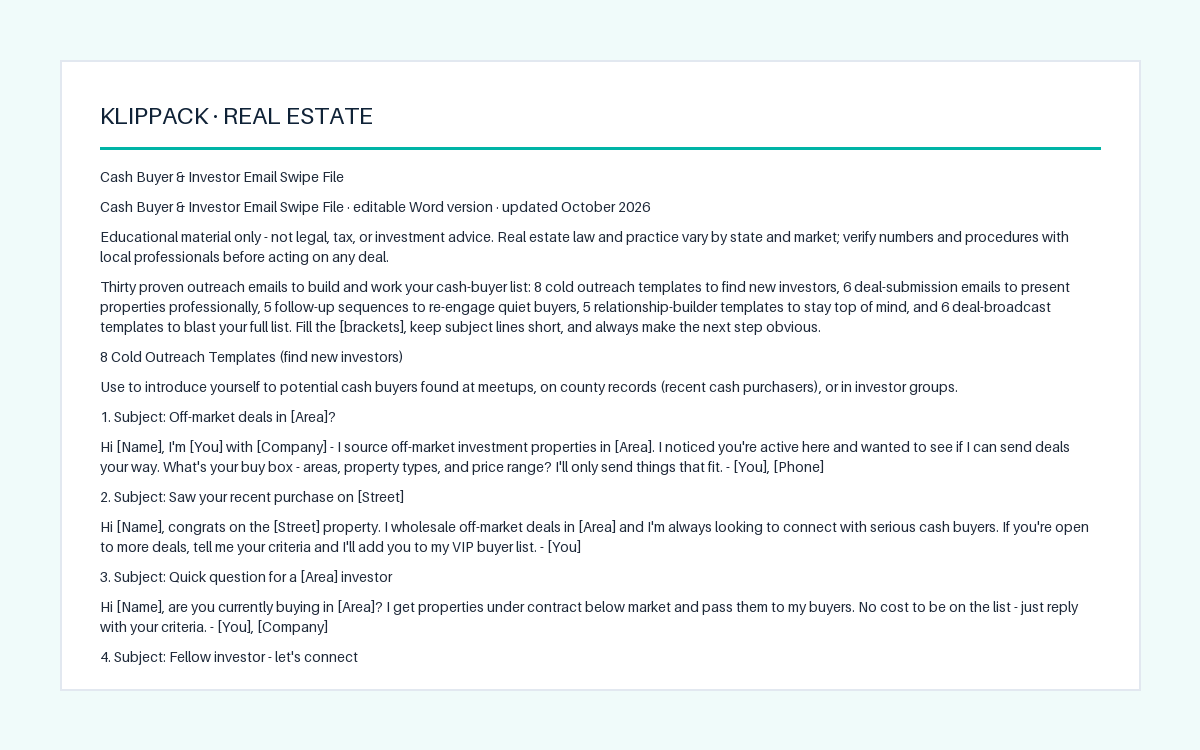
Cash Buyer & Investor Email Swipe File
30 fill-in-the-brackets emails to build and work a cash buyer list
- ✓8 Cold Outreach emails to introduce yourself to new investors
- ✓6 Deal Submission emails: flip, rental, pocket deal, price drop
- ✓5 Follow-Up emails to re-engage quiet buyers, ending in a last call
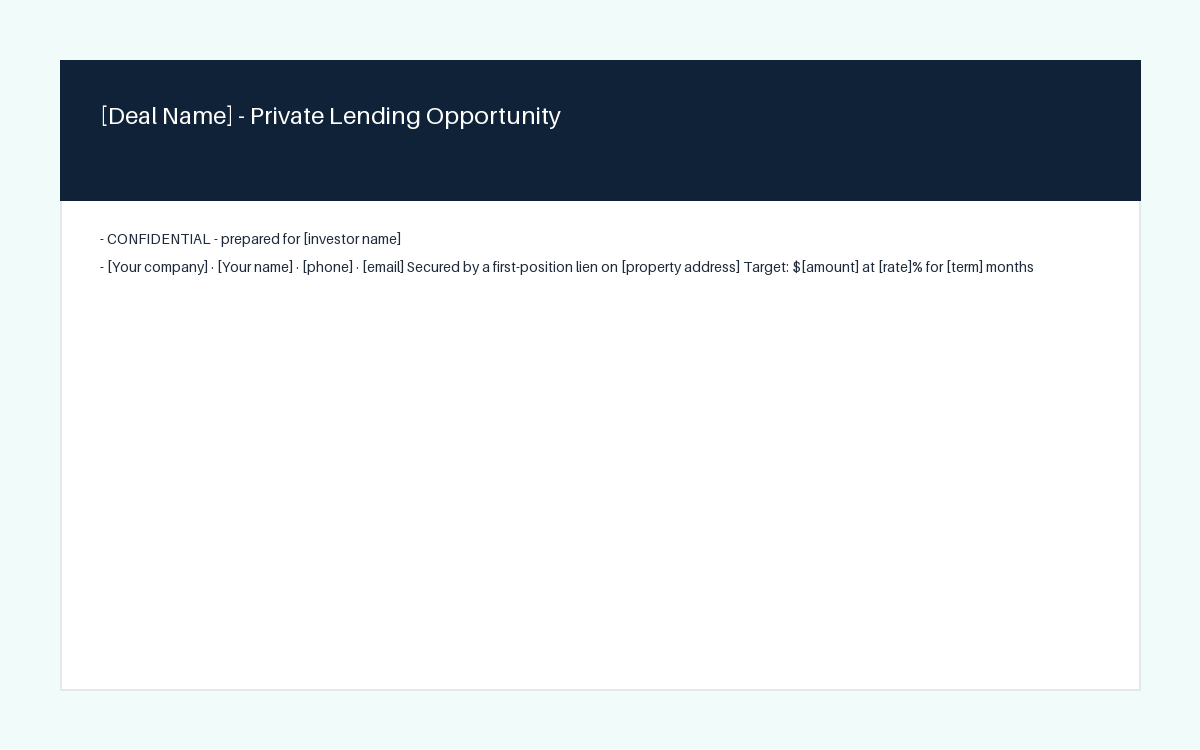
Private Money Pitch Deck Template
A 12-slide lender pitch with the security and downside slides investors ask for
- ✓Confidential cover: target amount, rate, term, and secured property
- ✓Opportunity, Track Record, and Team slides with bracketed proof points
- ✓Deal and Numbers slides: all-in cost, ARV, loan-to-ARV, worst case